
Page 14 • (2,008 results in 0.023 seconds)
-
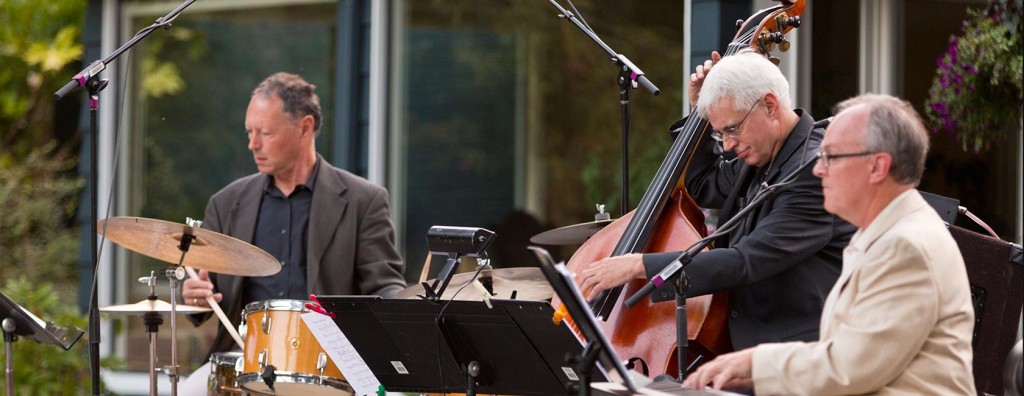
Showcase at Tula’s Will Feature the Jazz Sound Trio, the University Jazz Ensemble, Student Combos and Little Big Bands SEATTLE, Wash. (April 23, 2015)—Jazz music is a dish best served live and in person. A fusion of African-American, European-American and international musical traditions, jazz is…
23, 2015)—Jazz music is a dish best served live and in person. A fusion of African-American, European-American and international musical traditions, jazz is known for its energy, creativity and ingenuity. Its iconic founding fathers and mothers are revered as some of the greatest improvisational artists in modern history.No performance stage is too grand or too modest for the lively genre, but jazz music may be most at home in culturally vibrant metropolitan nightclubs. New Orleans, Chicago and
-
Signed Consent Form (for research assuring Confidentiality, NOT Anonymity) Cover Letter (for use with low-risk, anonymous, surveys in hard copy format) Online Cover Letter (for use with low-risk,
Investigators must have every potential participant who is a physically and mentally able adult (at least 18 years old) provide consent prior to the initiation of the actual research. There are additional safeguards in place for populations who do not meet this description, whether due to age, disability, or other protected status. The consent process is typically made up of two parts: a discussion between the the researcher and the potential participant, and a written document (either a “consent form” or
-

Troy Storfjell is a member of the Sámi community, the only indigenous group in Norway that’s been historically marginalized. It’s why Storfjell, who passes as white in the U.S.
American and Indigenous Studies” in spring 2019. “One of the things that we hope this program will do is give space for indigenous students to feel a little more at home,” Storfjell said. “But that doesn’t mean that we want this program to only be for indigenous students.” For example, Storfjell said, the program could appeal to nursing students who might someday work with indigenous populations, or to business students who might someday work with nonprofits or indigenous institutions. And, he said
-
All Religion majors complete a major research project. Recent capstone projects completed by Religion majors are listed below.
Nicole Claire Johnson, Orientalism in a Galaxy Far, Far Away: Stereotypical Portrayals of Asian Religions in Star Wars Callie Rae Moothart, “To Be Contained and Restrained” – American Evangelicals and Sexual Abstinence David Olivas, The Secret to Success: Soka Gakkai International Buddhism Karen Riede, The Contributions of Three Women to the Protestant Reformation Maddie Schneider, The Command of Queen Esther: An Analysis of a Jewish Woman as Leader in a Persian Patriarchal Society Ruben Edvard
-
There are some great benefits to joining a new program at PNWU School of Physical Therapy. Some highlights: small faculty to student ratios, state-of-the-art cadaver dissection laboratory, simulation center, and the Center for Applied Movement Sciences lab. The Center for Applied Movement Sciences lab is part of…
patients with various neurological conditions using leading-edge technology. In addition, students work at the Yakima Union Gospel Mission PT pro bono clinic, where you will serve some of our communities most vulnerable populations. PNWUs Doctor of Physical Therapy students focus on improving movement-based impairments but also learn to advocate for better care for uninsured and underinsured populations. The tuition at PNWU is inclusive of other fees such as textbooks, iPad and anatomy apps, scrubs for
-
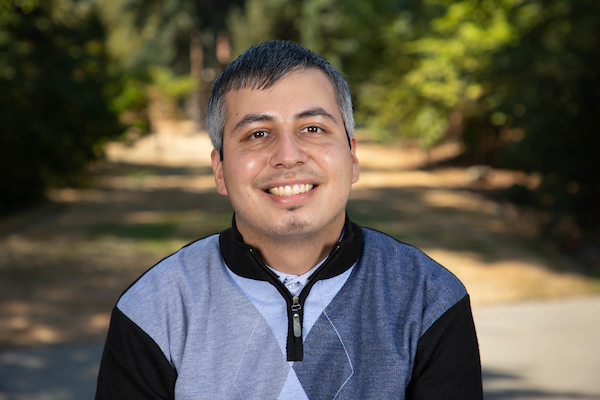
Assistant Professor of Sociology and Criminal Justice | Department of Sociology and Criminal Justice | cuevasgv@plu.edu | 253-535-7644
Gerardo Cuevas-Buendia Assistant Professor of Sociology and Criminal Justice Phone: 253-535-7644 Email: cuevasgv@plu.edu Office Location: Xavier Hall - 244 Professional Education Ph.D. , Sociology, The Pennsylvania State University, 2021 M.A., Criminology, The Pennsylvania State University, 2016 B.A., Sociology, University of California, Los Angeles, 2014 Areas of Emphasis or Expertise Criminology Juvenile Justice Race and Education [School Discipline] Urban Inequality Latina/o/x Populations
Area of Emphasis/Expertise -
Biology Courses The following courses are required by most programs: BIOL 225: Molecules, Cells, and Organisms BIOL 226: Genes, Evolution, Diversity and Ecology You might also consider some of the
. Department of KinesiologyGraduates of the Pre-PT program at PLU are admitted into PT programs at rates that exceed the national average.In general, the following coursework satisfies the required and recommended courses for admission to a school of physical therapy. Note this represents general guidelines and requirements vary from one school to the next. Prerequisites for grad schools in Washington: University of Washington University of Puget Sound Eastern Washington University The American Physical
-

On a chilly February morning, cars packed the parking lot of the Pacific Lutheran University Olson Fieldhouse. There was no basketball game or volleyball match enticing the visitors, but rather a historic event that brought visitors in that day. It was the first of many…
themselves to the welfare of those in their care and do their part in curtailing this deadly virus. To learn more about how you can support PLU students visit plu.edu/advancement. A PLU nursing student walks a patient through a pre-vaccination form. More from PLU Read Previous Standing with our Asian and Asian American Pacific Islander community members Read Next PLU announces plans for virtual spring commencement 2021 COMMENTS*Note: All comments are moderated If the comments don't appear for you, you
-
About PAT Phi Alpha Theta (ΦΑΘ) is an American honor society for undergraduate and graduate students and professors of history.
On May 8, 2024, a new group of History students joined the PLU chapter of Phi Alpha Theta. Phi Alpha Theta History Honors SocietyAbout PAT Phi Alpha Theta (ΦΑΘ) is an American honor society for undergraduate and graduate students and professors of history. The society has over 400,000 members, with about 9,500 new members joining each year through 860 local chapters. We are a professional society whose mission is to promote the study of history through the encouragement of research, good
Do you have any feedback for us? If so, feel free to use our Feedback Form.